ALICE ECONOMIC VIABILITY DASHBOARD
Measuring Economic Well-Being for ALICE
The ALICE Economic Viability Dashboard reveals the economic and community conditions of people who are struggling financially — those below the ALICE Threshold. This includes people in households with income below the Federal Poverty Level (FPL) and those who are ALICE (Asset Limited, Income Constrained, Employed), with income above the FPL but below the cost of basics.
By studying ALICE households as well as those in poverty, United For ALICE research shows the true extent of financial hardship across the country. The ALICE Economic Viability Dashboard builds on this research, exploring why so many households are struggling, with new data on ALICE work, housing, and community resources.
Hover/click on the elements below to learn more:
Work

Explore the percentage of full-time workers below the ALICE Threshold who earn enough to afford the Household Survival Budget (1 adult and 1 school-age child) and gain deeper understanding of ALICE workers in the state and local labor force. Variables include:
- Workers below the ALICE Threshold and their wages, demographics, common industries, educational attainment, and commute time
- People below the ALICE Threshold who are out of the labor force and their characteristics
Housing

See the percentage of households below the ALICE Threshold in affordable housing, along with other key variables, including the percentage of households below the Threshold who…
- Own their home
- Are rent or owner cost burdened
- Are renting yet paying more than median owner costs
Community

Better understand the supports that communities provide to help ALICE meet basic needs, including…
- Preschool enrollment
- High-speed internet
- Commute time
- Health insurance
- Grocery store access
Gaps

Use the Gap Map and index scores to see and compare community performance on each domain (Work, Housing, Community).
What can users do with this dashboard?
- Explore data on work, housing, and community resources for households below the ALICE Threshold by location and race/ethnicity
- Compare any two locations on key ALICE work, housing, and community conditions
- Create action plans to remove barriers, fill gaps, and make structural changes needed to improve conditions for workers and households in your state or local community
What is unique about this dashboard?
- It focuses specifically on workers and households that are unable to afford the basics based on income and local cost of living
- It combines economic and equity perspectives
- It offers actionable data and best practices to address gaps across states and local communities
Who is this dashboard for?
- Community planners, engineers, builders, real estate developers, zoning experts, and housing advocates
- Local, state, and federal policymakers
- Chambers of commerce and economic development agencies
- United Ways and other key community nonprofit organizations
- Advocates working for equity in education, food, transportation, health care, and technology
ALICE Economic Viability Dashboard Framework & Variables
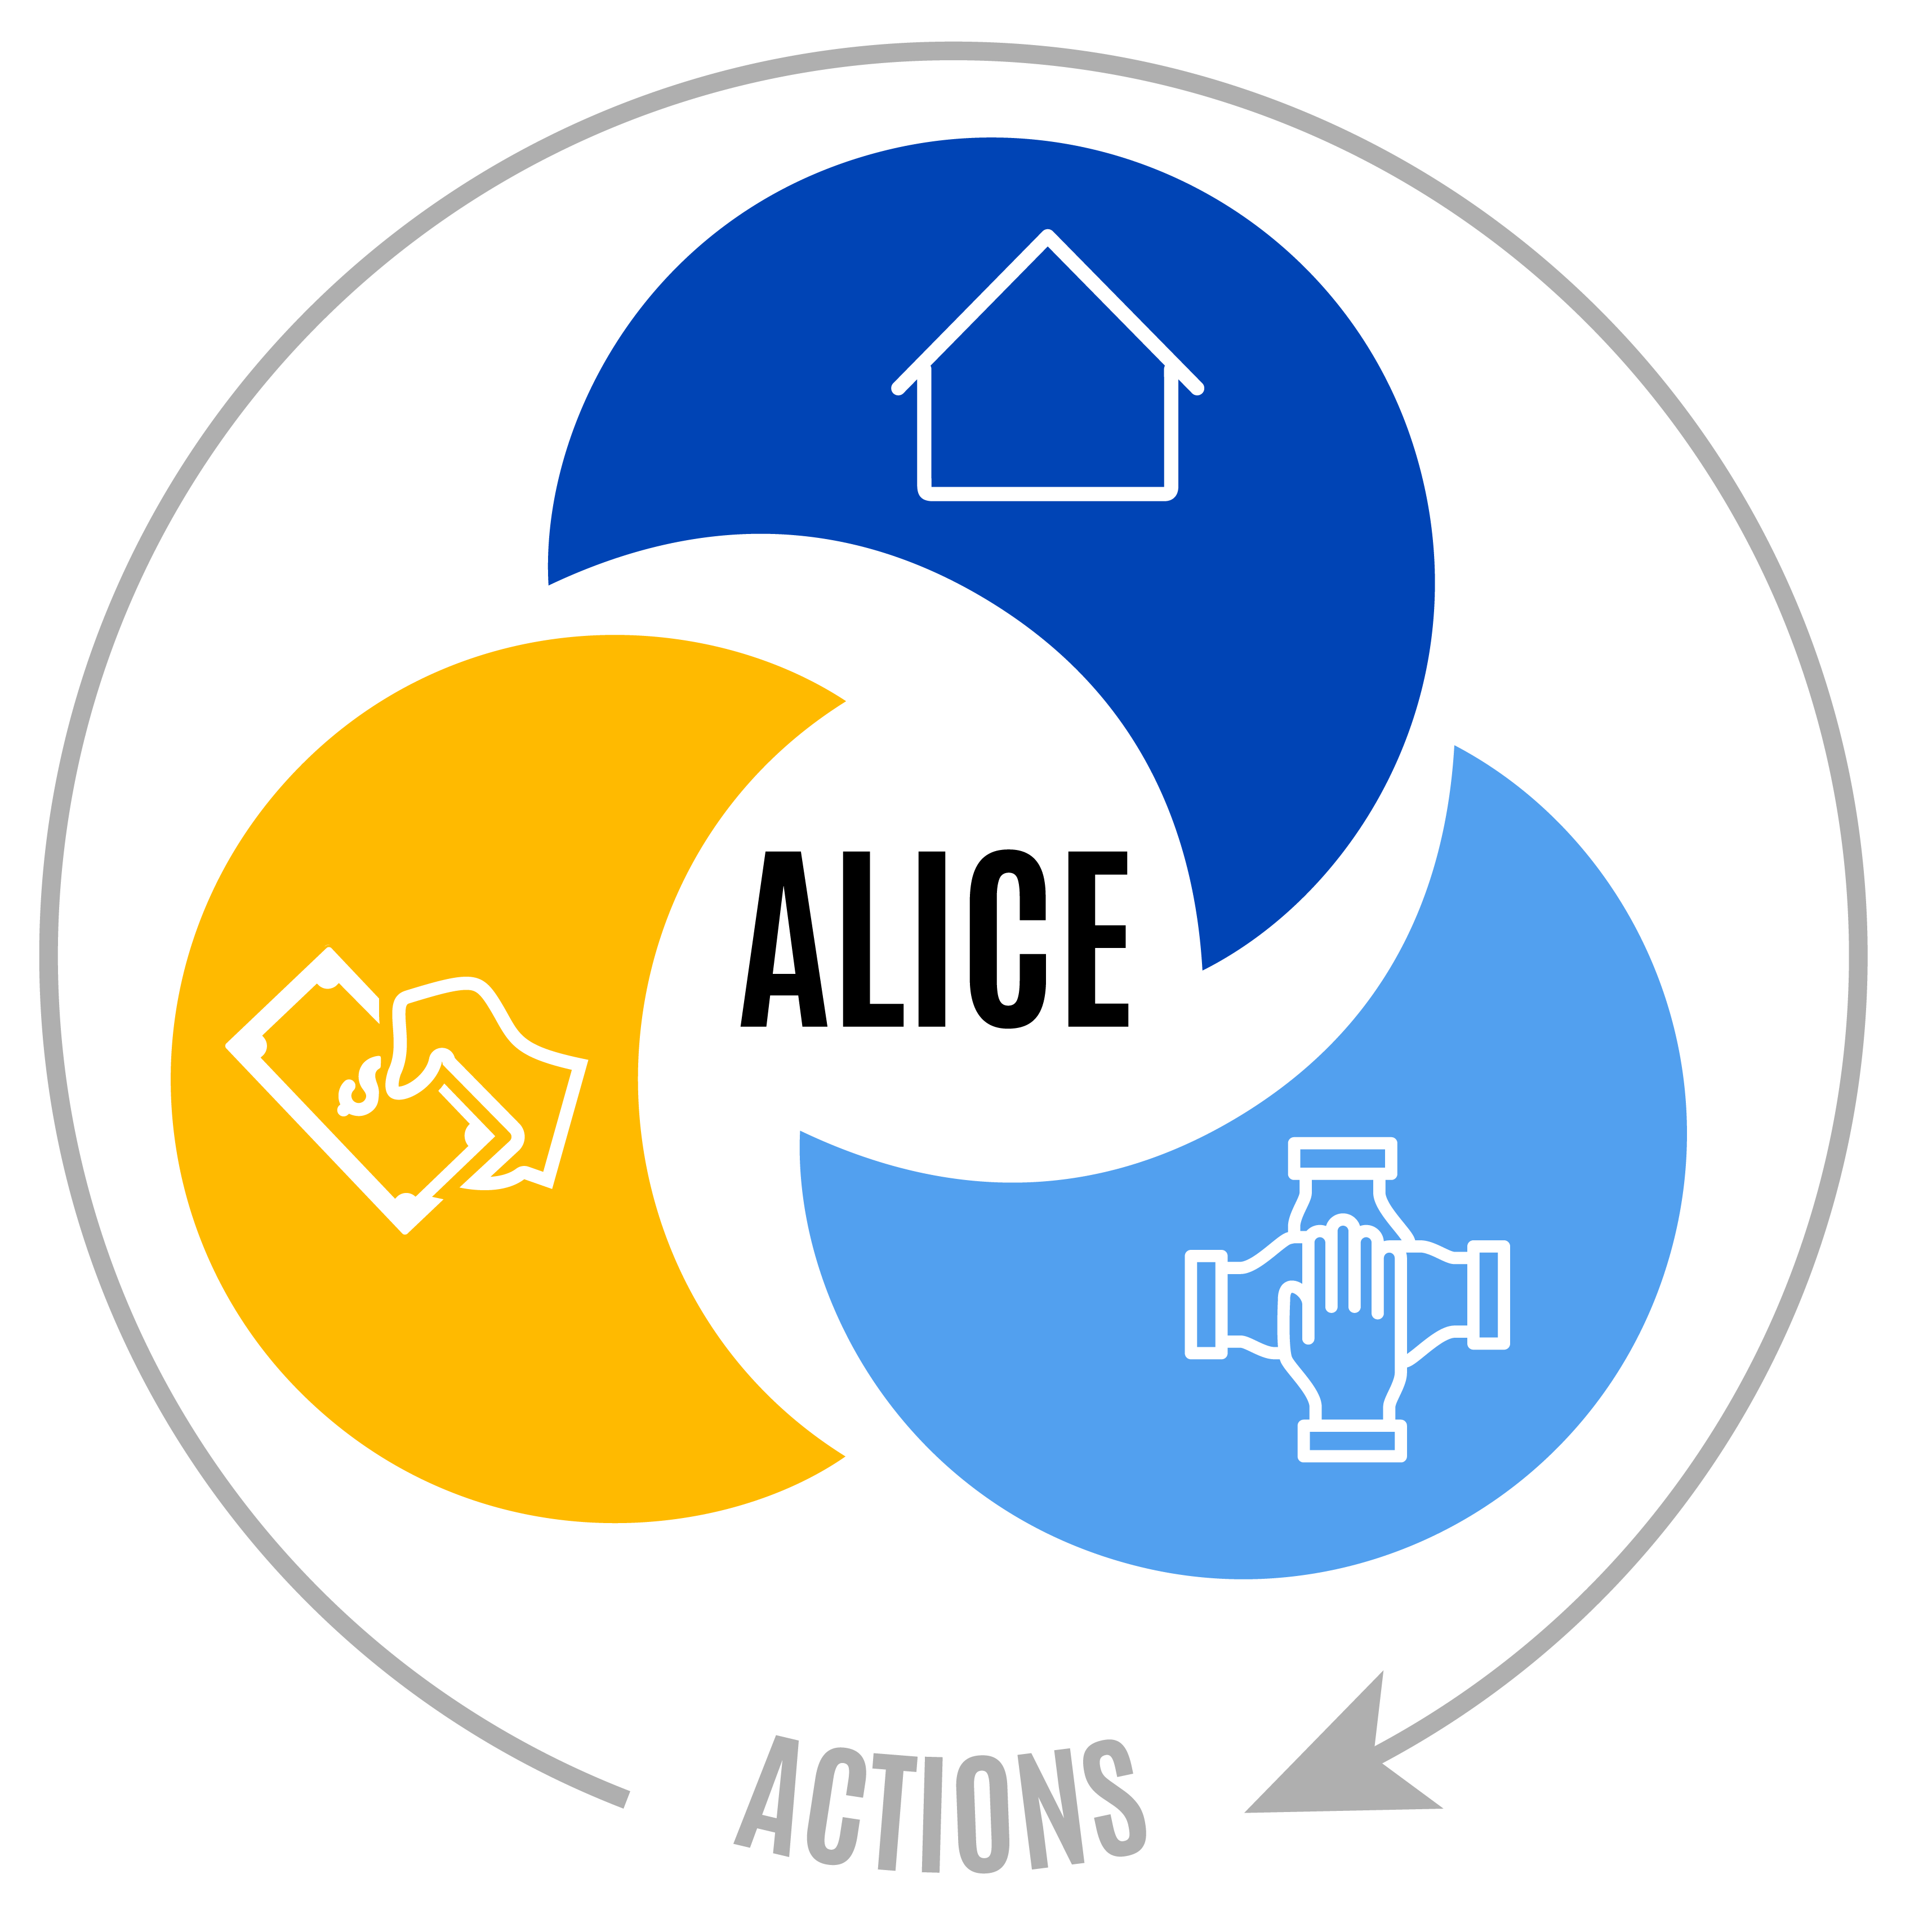
All three of the ALICE Economic Viability Dashboard domains — Work, Housing, Community — are key to financial stability. Workers and households below the ALICE Threshold need affordable housing, in close proximity to jobs that pay livable wages, in communities that support their basic needs.
Yet in many places, there are gaps. For example, communities where there are good jobs, but a shortage of affordable housing. Or a city with great housing and community supports, but lacking in quality jobs to attract workers.
With the ALICE Economic Viability Dashboard, users can explore the economic and community conditions of workers and households below the ALICE Threshold, identify gaps, and take action to support ALICE households in their communities.
Use the Work, Housing, and Community buttons below to see the variables included in each domain.
Key Variable: Work
Full-Time Workers Earning Enough for Household Survival Budget (1 Adult, 1 School-Age Child) [with break-out by race/ethnicity]
Description: Full-time workers with a reported wage who earned enough to cover the ALICE Household Survival Budget for one adult and one school-age child. See our Methodology for more details about the Household Survival Budget.
Source: ALICE Threshold, 2023; ACS PUMS, 2023
Why is this variable included? This is the key variable for the Work domain; the wages that workers earn are directly connected to their financial stability. The budget for one adult and one school-age child was chosen as it includes all the budget categories and is easily scalable (e.g., two adults, two school-age children).
Supporting Variables
-
Most Common Industries for Workers Below ALICE Threshold with Number of Workers and Average Hourly Wage
Description: Industries with the largest number of workers below the ALICE Threshold and their average hourly wages (with average hourly wages based on full-time work with reported income)
Source: ALICE Threshold, 2023; ACS PUMS, 2023
Why is this variable included? Knowing the top industries for workers below the ALICE Threshold can help identify where wage gaps exist and help target workplace/business initiatives.
-
Work Schedules, Full-/Part-Time for Workers Below ALICE Threshold
Description: Of all workers below the ALICE Threshold, the share who worked full time (at least 35 hours per week, 50 weeks per year) and the share who worked part time (less than 35 hours per week, 50 weeks per year)
Source: ALICE Threshold, 2023; ACS PUMS, 2023
Why is this variable included? Different work schedules come with various benefits and drawbacks, but in general, part-time work is associated with less predictability and fewer benefits.
-
Characteristics of Workers Below ALICE Threshold (Age, Educational Attainment, Commute Time)
Description: A break-out of all workers below the ALICE Threshold by educational attainment, age group, and commute time to work (does not include people who were unemployed)
Source: ALICE Threshold, 2023; ACS PUMS, 2023
Why is this variable included? These characteristics of workers below the ALICE Threshold can help define the working community in different geographic areas, and help stakeholders tailor initiatives to best serve their ALICE workforce.
-
Below ALICE Threshold Not Working but Looking for Work (Unemployed)
Description: The unemployment rate for people below the ALICE Threshold – those who were not employed, but were looking for work
Source: ALICE Threshold, 2023; ACS PUMS, 2023
Why is this variable included? This is a key population to identify, as matching jobseekers with quality jobs benefits workers, employers, and the wider community.
Contextual Variables (Action Planner Only)
-
Below ALICE Threshold Out of Labor Force, With One or More Children in the Household; With a Senior in the Household; With a Person With a Disability in the Household
Description: The share of people below the ALICE Threshold age 16–64 who were not working and not looking for work, along with this rate among people currently in school/training, with one or more children in their household, with one or more seniors in their household, or with a person with a disability in their household (including themselves)
Source: ALICE Threshold, 2023; ACS PUMS, 2023
Why are these variables included? There are many reasons why working-age adults are not in the labor force, including caregiving (for children, seniors, people with disabilities), school/education/training, not being physically able to work , not being able to find a position in previous job searches, and more.
-
Adults (Age 18+) Below ALICE Threshold in School; With a High School Diploma; With Some College or Higher
Description: These three variables include adults (age 18+) below the ALICE Threshold who were enrolled in school; have a high school diploma as their highest level of education; or have “some college” or higher as their highest level of education
Source: ALICE Threshold, 2023; ACS PUMS, 2023
Why is this variable included? A quality education lays the groundwork for future employment opportunities and long-term economic stability. Nationwide, high school graduates have lower unemployment rates and higher median earnings than people without a high school diploma. Higher educational attainment is also associated with better physical and mental health and a lower likelihood of incarceration. While the national high school graduation rate has been increasing over time, there are persistent gaps in educational attainment by race/ethnicity and socioeconomic status, largely driven by systemic forces such as institutional racism and housing discrimination.
-
Seniors (Age 65+) Below the ALICE Threshold Without Retirement Income
Description: People age 65 and older and below the ALICE Threshold who did not have any retirement income (not including Social Security payments)
Source: ALICE Threshold, 2023; ACS PUMS, 2023
Why is this variable included? For many seniors, Social Security income alone is not enough to cover costs. Without retirement income, many seniors end up working past traditional retirement age and are at greater risk of financial instability.
Key Variable: Housing
Renter Households below the ALICE Threshold Paying Equal to or Less than 30% of Income on Rent
Description: Renter households below the ALICE Threshold who paid less than 30% of their income on rental costs (including rent paid to the owner plus utility costs incurred by the tenant — electricity, gas, water/sewer, and trash removal services, but not telephone or internet service)
Source: ALICE Threshold, 2023; ACS PUMS, 2023
Why is this variable included? Being rent burdened can create financial hardship, especially for lower-income renters. When these households spend more than 30% of their income on rent, they must make difficult choices to decrease or even eliminate other expenses, such as food or medical care. Households with a high rent burden are also less likely to have money left over to allocate toward savings.
Supporting Variables
-
Homeownership, Below ALICE Threshold
Description: Households below the ALICE Threshold who own their home, with additional break-outs by race/ethnicity (where populations are large enough to display)
Source: ALICE Threshold, 2023; ACS PUMS, 2023
Why is this variable included? Homeownership is the most common way for families to build wealth over time. Compared to other living arrangements, the documented benefits of owning a home also include more consistent and predictable housing costs, increased employment opportunities, better health (both physical and mental), better school performance, and higher levels of civic engagement.
-
Owner Cost Burdened, Below ALICE Threshold
Description: Households below the ALICE Threshold who own their home who paid more than 30% of their household income on housing costs (including mortgage payment, utilities, association fees, insurance, and real estate taxes). Households that were severely owner cost burdened paid more than 50% of their income on housing costs.
Source: ALICE Threshold, 2023; ACS PUMS, 2023
Why is this variable included? Being housing burdened can create financial hardship, especially for lower-income homeowners. When these households spend a substantial portion of their income on housing costs, they must make difficult choices to decrease or eliminate their other expenses, such as food or medical care. Households with a high housing burden are also less likely to have money left over to allocate toward savings.
-
Rent-to-Own Gap, Below ALICE Threshold
Description: Renter households below the ALICE Threshold who paid more than or equal to median owner costs by number of bedrooms for the PUMA where they lived
Source: ALICE Threshold, 2023; ACS PUMS, 2023
Why is this variable included? In many communities, it is more affordable to own a home than to rent. And there are additional benefits to home ownership, as the value can build over time. However, especially in competitive housing markets, ALICE households can’t afford the initial investment needed to buy a home (down payment, taxes, real estate fees).
-
Rent Burden, Below ALICE Threshold
Description: Renter households below the ALICE Threshold who paid more than 30% of their income on rental costs (including rent paid to the owner plus utility costs incurred by the tenant — electricity, gas, water/sewer, and trash removal services, but not telephone or internet service). Households that were severely rent burdened paid more than 50% of their income on rent.
Source: ALICE Threshold, 2023; ACS PUMS, 2023
Why is this variable included? Being rent burdened can create financial hardship, especially for lower-income renters. When these households spend a substantial portion of their income on rent, they must make difficult choices to decrease or even eliminate other expenses, such as food or medical care. Households with a high rent burden are also less likely to have money left over to allocate toward savings.
Contextual Variables (Action Planner Only)
-
Access to Parks
Description: People living within one-half mile of a park (all income levels)
Source: Trust for Public Land, 2023
Why is this variable included? Parks are vital public spaces that provide opportunities for physical activity, leisure, and social connectivity. Parks are especially important for ALICE households who may have limited opportunities for healthy physical activity due to cost or transportation constraints (e.g., gym membership fees). Parks may also help to maintain or improve air and water quality and heat levels in communities.
-
Housing Stock Built Before 1970
Description: The share of local housing stock built before 1970
Source: ACS PUMS, 2023
Why is this variable included? While older homes can have character and value, if not properly maintained they are more likely to be energy-inefficient, have lead paint or pipes, or need more frequent (and often costly) repairs.
-
Median Annual Real Estate Taxes – All Households
Description: Median annual real estate taxes paid
Source: ACS PUMS, 2023
Why is this variable included? Real estate taxes represent an additional cost that can be a barrier to homeownership. Even for renters, real estate taxes are paid indirectly through rent payments; landlords facing tax increases often pass along that burden to renters through increased rental fees. But since real estate taxes also support local services and schools, ALICE families (especially those with children) may gain even more than what they pay in real estate taxes.
-
Homeowner Households Below the ALICE Threshold Without Fire/Hazard/Flood Insurance
Description: Households below the ALICE Threshold who own their home and do not have fire, hazard, and/or flood insurance
Source: ALICE Threshold, 2023; ACS PUMS, 2023
Why is this variable included? Unexpected emergencies can be especially difficult for those without the financial resources to weather them. Without insurance, repair costs for floods, fires, and other hazards can be unmanageable for those who were already facing financial instability.
-
Households Below the ALICE Threshold With Incomplete Kitchen Facilities
Description: Households below the ALICE Threshold living in a housing unit that lacks a sink with running water, a stove or range, or a refrigerator.
Source: ALICE Threshold, 2023; ACS PUMS, 2023
Why is this variable included? Poor housing conditions have been linked with worse health outcomes and infectious disease spread.
Key Variable: Community
Community Composite Score, Below the ALICE Threshold
Description: A composite (combined) score of the Supporting Variables in this Domain (see below)
Source: ALICE Threshold, 2023; ACS PUMS, 2023
Why is this variable included? Community is a multi-faceted concept. This composite Community Score includes key community supports that are included in the ACS PUMS dataset and represent additional items in the ALICE Household Survival Budget.
Supporting Variables
-
Preschool Enrollment, Below ALICE Threshold
Description: Children age 3–4 in households below the ALICE Threshold who were enrolled in school
Source: ALICE Threshold, 2023; ACS PUMS, 2023
Why is this variable included? A quality education is the best predictor of professional and financial success in the U.S., and the earliest years of a child’s education lay a critical foundation for that success. Lack of quality preschool can impact success in kindergarten — and far beyond.
-
High-Speed Internet at Home, Below ALICE Threshold
Description: Households below the ALICE Threshold with high-speed internet access at home
Source: ALICE Threshold, 2023; ACS PUMS, 2023
Why is this variable included? Access to digital technology exploded over the last three decades, yet that access still varies by income and geography. Low-income adults are more likely to own smartphones than to have broadband internet access, while more than 90% of households earning more than $100,000 have both. And for many families, that lack of access translates directly to reduced job opportunities, educational opportunities, health care access, and financial tools.
-
Workers Below ALICE Threshold Commuting 30 Minutes or Less, Below ALICE Threshold
Description: The percentage of workers below the ALICE Threshold commuting 30 minutes or less to work
Source: ALICE Threshold, 2023; ACS PUMS, 2023
Why is this variable included? Many lower-cost housing units are located far from jobs and services, which means that ALICE workers often live and work in different communities. Longer commute times are associated with decreased physical activity and increased risk for cardiovascular and respiratory issues, due to air pollution and stress from traffic congestion. In addition to increasing transportation costs (especially for workers who commute by car), longer commute times can also contribute to the need for additional child care and leave fewer hours available for work.
-
Health Insurance for Working-Age Population, Below ALICE Threshold
Description: Share of adults below the ALICE Threshold (age 16–64) with health insurance
Source: ALICE Threshold, 2023; ACS PUMS, 2023
Why is this variable included? Health insurance status has a significant impact on when and where people access care, how much health care costs, and overall health status. Uninsured adults are four times as likely as those with coverage to delay or forgo care, often waiting to seek treatment until an illness is advanced or pain is unbearable. Because half of all uninsured people have no usual source of care, many go to the emergency room for help because they have no other affordable, accessible options.
-
Grocery Store Access, Below ALICE Threshold
Description: The number of supermarkets and other grocery (except convenience) stores per 100,000 households below the ALICE threshold
Source: ALICE Threshold, 2023; County Business Patterns, 2022
Why is this variable included? The accessibility, availability, and affordability of healthy and varied food options in the community increase the likelihood that residents will have a balanced and nutritious diet. Having grocery access nearby one’s home also cuts down on time spent traveling, leaving more time for other essential household tasks.
Contextual Variables (Action Planner Only)
-
Youth not in School/Unemployed/Not in Labor Force
Description: 16- to 19-year-olds who are not enrolled in school and either unemployed or not in labor force
Source: ALICE Threshold, 2023; ACS PUMS, 2023
Why is this variable included? Teenagers who are not in school and not working are more likely than their in-school/employed peers to engage in violent and high-risk behavior (such as drug use and alcohol consumption), and to have social and emotional issues. In addition, both low educational attainment and unemployment are associated with poorer mental and physical health outcomes.
-
Average Life Expectancy at Birth
Description: The average number of years a person can expect to live determined by the mortality rate for the county in which they live
Source: University of Wisconsin Population Health Institute, 2022
Why is this variable included? Life expectancy is an indicator of a population's longevity and overall health. While life expectancy has been increasing over time in the U.S., there are still significant differences by race/ethnicity and geographic location. Both life expectancy and general health are influenced by individual factors such as health behaviors and genetics as well as by larger, systemic factors known as social determinants of health, which play out throughout a person’s lifetime.
-
Primary Care Provider Rate
Description: The number of primary care physicians per 100,000 population (all income levels)
Source: University of Wisconsin Population Health Institute, 2021
Why is this variable included? Primary care providers are important to ALICE families because they provide routine checkups, preventative screenings, and referrals for their patients and maintain continuous health records that give insight into ongoing health conditions and needs. Emergency services are expensive for ALICE families and the larger community, and their use for non-emergency health issues is often avoidable when families have access to affordable, quality primary care.
-
Mental Health Provider Rate
Description: The rate of mental health providers per 100,000 population (all income levels)
Source: University of Wisconsin Population Health Institute, 2024
Why is this variable included? Living in a community with a high mental health provider rate increases the likelihood that community members will access care when they need it, which has concrete effects on overall health. Mental health issues impact multiple aspects of a person’s life, and delays in mental health treatment are associated with increased morbidity and mortality, including the development of chronic co-existing psychiatric and physical disorders.
-
Dentist Rate
Description: The number of dentists per 100,000 population (all income levels)
Source: University of Wisconsin Population Health Institute, 2022
Why is this variable included? People who live in communities with a low rate of dentists may have trouble accessing the dental care they need — both preventative care and treatment for oral health issues. People without accessible dental health care are far more likely to suffer from tooth decay and gum infection, which can increase the risk of cancer and cardiovascular diseases and can affect speech, nutrition, sleeping, learning, playing, and overall quality of life.
-
Households Below the ALICE Threshold With Cellular-Only Internet Access
Description: Households below the ALICE Threshold with a cellular data plan and no other type of internet subscription
Source: ALICE Threshold, 2023; ACS PUMS, 2023
Why is this variable included? Smartphone-only internet users are more likely than other internet users to use phones for job searches/applications and online shopping and banking. People who rely on smartphones for internet access may face gaps in service and access and issues related to data storage (such as limited free storage) and small screens (such as difficulties with detailed tasks like word processing).
-
Tax Support
Description: The number of IRS tax returns filed at Volunteer Income Tax Assistance (VITA) sites per 100,000 households
Source: Internal Revenue Service, 2022
Why is this variable included? VITA programs offer free basic tax return preparation to qualified individuals, including people who generally make $60,000 or less; people with disabilities; and limited-English-speaking taxpayers.
-
Payday Lender Rate
Description: Number of alternative credit lender services per 100,000 people. Alternative credit lender services include check cashing services, loan servicing, money order issuance services, money transmission services, payday lending services, and travelers’ check issuance services.
Source: County Business Patterns, 2022
Why is this variable included? Alternative credit lender services — like payday lending, loan servicing, and check cashing services — often come with fees and high interest rates for borrowing. A high number of these services in a given geographic area can also signify a large unbanked population. People who are unbanked are unable to receive direct deposits from an employer and aren’t building a credit history for future borrowing.

